Checking the continuity between two surfaces
After starting the Check Continuity command proceed as follows:
- In the Type drop-down list select Surface - surface.
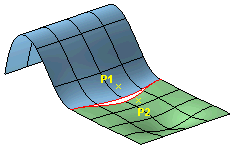
- Click on the two surfaces. Select the surfaces near the border where you want to check continuity, as indicated by points P1 and P2 in the following illustration. The closest borders, which will be taken into account in the computation, will be highlighted.

The program immediately displays the following data concerning the two surfaces along the selected borders:
- The maximum distance between the two surfaces
- The mean distance
- The maximum angle formed by tangents with the common direction
- The maximum angle between the normals
- The minimum angle between the normals
- The mean angle between the normals
- The percentage value of the maximum curvature difference
- The percentage value of the minimum curvature difference at the point of maximum curvature difference
- The average percentage value of the maximum curvature difference values, which can be very useful in a number of situations, for example when, though the maximum difference might be very small, the average value might be considerable.
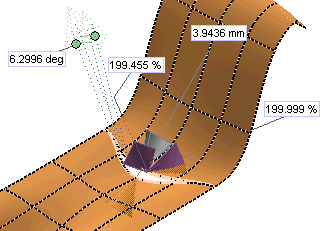
In addition, the program displays some arrows on the surfaces. The arrows with the continuous line indicate the two points with the maximum distance along the selected edges, if a significant distance value (that is: >1.e-3mm) is there. The arrows with the dotted line indicate the maximum angle between the normals (if >0.05°). Finally, the arrows displaying values are positioned at the point of maximum curvature difference and are oriented in the directions of the maximum and minimum curvature difference (if the maximum curvature difference is > 0.001%). The displayed values are the measured percentages.

Mathematics concepts related to this topic


