
In most Compensator commands, namely the following:
A Type drop-down list is available under the Graph node. It enables you to choose one of the following options:
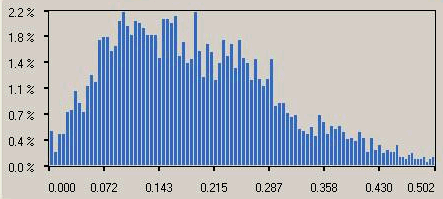
| Distribution | To create a distribution graph, thus displaying the number of points with a particular value. |
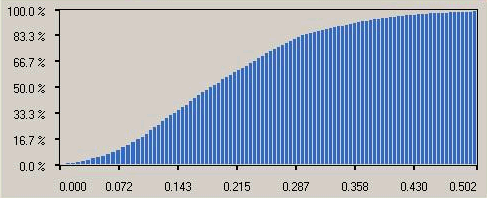
| Repartition | To create a repartition graph, thus displaying the total amount of points below a particular tolerance (the sum starting from value 0). |
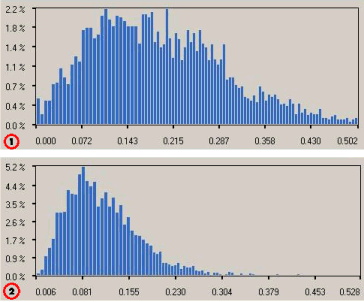
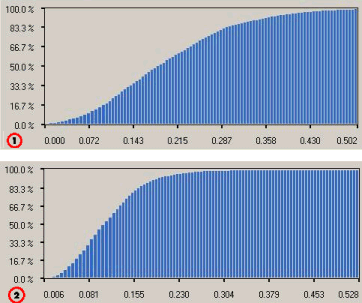
Graphs can be very useful, for example, to check that the optimization actually improved your results.
 |
| 1) Distribution 2) Distribution - Optimized |
 |
| 1) Repartition 2) Repartition - Optimized |