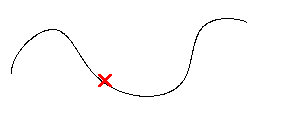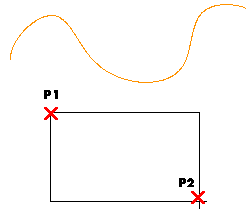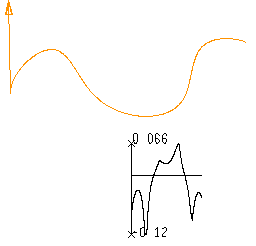

The program immediately creates the graph of the curvature of the curve as a function of its parameter. The highest and lowest values are shown and an arrow is displayed on the curve to indicate the direction in which the parameter increases.


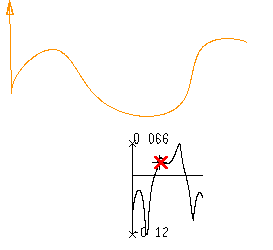
The program displays the values of the parameter, curvature, and radius of curvature at the indicated point. To repeat the analysis at another point, right-click on Point on diagram, select reset and specify another point on the diagram.