The Curve Target Curvature command enables you to modify a contour by changing its curvature plot. In many situations you may have contours with a curvature plot that is smooth along the largest part of the contour itself, but with some zones that are not. In these cases you may want to change the curvature of those parts by defining new curves with a curvature plot such that the one of the curves to modify matches the defined and selected curvature curves. In fact, if the curvature plot of a contour is not completely smooth, shapes derived from that curve may actually be bad ones.
Note
Please take into account that the command refers to the curvature — not to the radius of curvature — and that the curvature plots you can use as references for a comparison between the selected curves and the target ones can be obtained through the
Curvature command:
- With the Reverse check box cleared
- With a positive value of the Scale, so that the quantity drawn along the normal has the same sign as the curvature.
In addition, also consider that the Reverse check box is available the selection list. Similarly to what happens in the
Curvature command, it enables you to work with a target curvature plot that can be considered as reverted or not. Please note that you can use the
Curvature command during a session of the
Curve Target Curvature command (without interrupting it) so as to check the shape of the curvature plot for the modified curves in the preview.
- When the check box is not selected, the target curvature is considered as not reverted.
- When the check box is selected, the target curvature is considered as reverted.
|
First of all, display the curvature plot with a certain value of the Scale. Then proceed as follows.
- Display the curvature plot of the contour and set the Scale to the desired value.
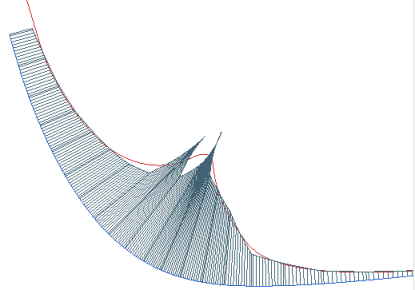
If the curvature plot is not completely smooth, start the Curve Target Curvature command.
- Select the set of curves to be modified (Curves)
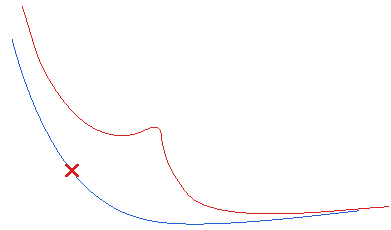
- To set the same continuity conditions at both ends of the curve check the Same Continuity box. Uncheck it to differentiate it.
- Select the continuity conditions (Continuity) you want to set, which can be:
Position,
Tangency,
Curvature,
Torsion,
Smooth curvature,
Curvature plot curvature. See "
Continuity Types" for details.
- Select the target Curvature Curves (curves representing the curvature plot which matches your needs). See also details in "Target curves and tangency discontinuity points".
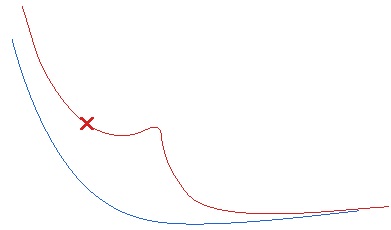
- Set the Scale to the same value as the one you used for the curvature plot of the original contour.
- In the Project Onto drop-down list you can choose one of the following options.
| Plane |
A projection plane to be defined using one of the methods available in the Projection Plane drop-down list. See "Plane Definition Modes" for details. |
| View |
The view plane. |
A message is also issued, providing the maximum distance between the projection of the initial curve on the selected plane and the projection of the modified curve on the same plane and also highlighting its location.

| Max. distance on the projection plane from the initial curve=12.5209 mm |
|
Select View. Take into account the modification will performed according to the following scheme:
- The set of selected curves is first projected onto the selected plane.
- The modification is applied to the projected contour.
- The curves thus obtained are then re-projected onto a temporary support surface based on the selected original contour so as to get the final 3D contour.
- The scale and reverse Default check box is also available in the selection list.
- When the box is cleared, you can make your own choices manually.
- When the check box is selected, best fit values for scale and reverse are automatically computed once you have provided the curve, the target curvature and the projection plane.
- Confirm to obtain the modified curve:
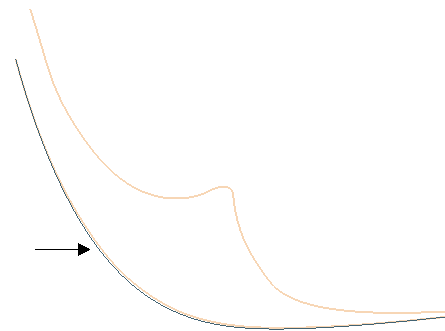
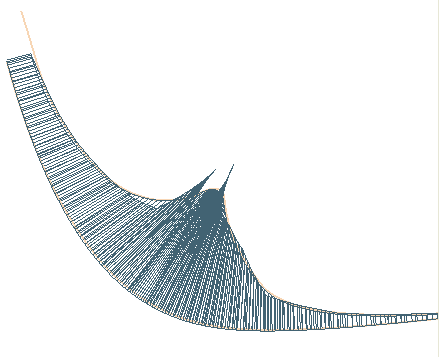
If you display the curvature plot, you will see the one of the modified curve is smooth:
Constraint compatibility
Please note that if the continuity conditions you have set are not compatible with the curvature curves you have selected, the ones that will actually be taken into account are the continuity constraints. |
- The result is computed with an optimization process for which you can set some parameters under the More Options node.
Under Optimization Parameters:
| Max. No. of loops |
Enables you to set the maximum number of iterations. Decrease the number to reduce the execution time (but the result will generally be worse) |
And, under Form Factor:
| Degree |
Enables you to enter the polynomial method of the form factor: 1 is linear, 2 parabolic, 3 cubic and so on. |
| Flexibility |
Enables you to set the flexibility of the result. Increase this number to better optimize the result. |
| Default |
enables you to choose whether the Degree and
Flexibility values are to be set automatically or not:
- When the box is cleared, you can make your own Degree and
Flexibility choices manually.
- When the box is checked, appropriate values for Degree and
Flexibility are provided according to the continuity constraints.
|
- The Associative Mode check box enables you to control the associativity of the result (see "
Associativity" for details).
- When the check box is selected, the resulting curve will be associative. The new curve will retain a link to the entities it derives from. A specific node displaying both the original entities and the resulting associative curve will be added to the Model Structure.

- When the check box is cleared, the resulting curve will not be associative.
Associative Mode and
Default
Please note that in associative mode (that is, when the Associative Mode box is checked), if a
Default box is checked, the corresponding parameters (scale and reverse or degree and flexibility values) are not saved. As a consequence, when rebuilding the model they are computed automatically. |
Target curves and tangency discontinuity points
Also target Curvature Curves with tangency discontinuity points can be used: tangency discontinuity points will be taken into account in the computation to generate the plot.
In the following image the violet curve is the original curve, while the green ones are the curvature target curves.

And here is the result of the Curve Target Curvature in the new version.

|


 Curve
Curve Target Curvature


