The Curve Tension command enables you to modify a contour — that is: a chain of consecutive curves — by changing its tension value.
Tension is a characteristic of a curve related to curvature and controlled through a real value, in our system varying from -1 to +1:
- The higher the tension value in a certain region, the lower the curvature (and obviously the higher the radius of curvature).
- The lower the tension value in the same region, the higher the curvature (and the higher the radius of curvature).
To modify the tension of a contour, you can proceed as follows.
- Select the set of curves of the contour (Curves).
- To set the same continuity conditions at both ends of the curve check the Same Continuity box. Uncheck it to differentiate it, in which case you will have to specify the
Start Continuity and the
End Continuity values.
- Select the continuity conditions you want to set, which can be: Position,
Tangency,
Curvature,
Torsion,
Smooth curvature,
Curvature plot curvature. See "
Continuity Types" for details.
- Select the Projection Plane (see "
How to define a plane" for details). Take into account the modification will be performed according to the following scheme:
- The set of selected curves is first projected onto the selected plane.
- The tension modification is applied to the projected contour.
- The curves thus obtained are then re-projected onto a temporary support surface based on the selected original contour so as to get the final 3D contour.
- Under the Zone Parameters node, you can define the tension parameters for a
Start Zone and/or for an
End Zone.
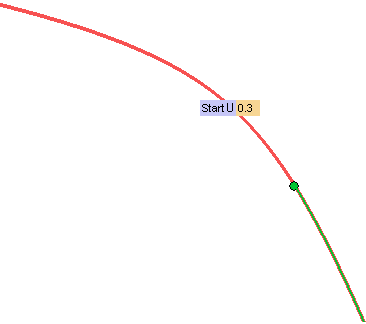
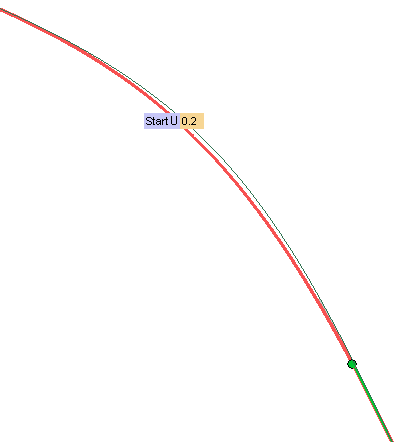
In both cases, first of all you can define the part of the curve to be affected either by dragging a specific handle or by supplying the corresponding curve parameter value in the associated mini-dialog box (Start u and
End u respectively).

- In the Start Zone/
End Zone drop-down lists, select:
| None |
No start zone is defined |
| Preserved |
To prevent that part of the curve from being affected by the modification. |
| Controlled |
To apply the modification to that part of the curve.
Please note that all the remaining parts of the curve (the ones not included in the start/end zone), will be affected by the modification but without being controlled. |
- Define the Start Tension Value/
End Tension Value. This value is a real number which can vary from -1 to +1: use negative values to decrease the tension (thus increasing the curvature) or positive values to increase tension (thus decreasing curvature).
- In order to assess the result before confirming it, select the preview button (
 )
)

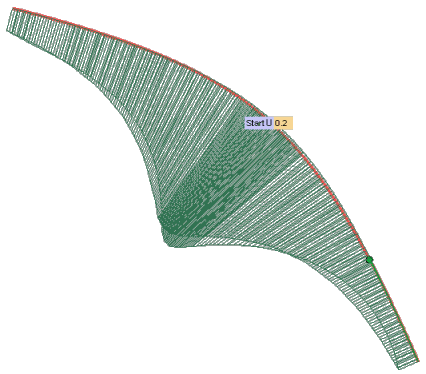
The result you obtained can be better assessed if you display the curvature plot:

The execution is optimized, so as to get the best result possible, thus, sometimes, requiring some time to complete. Because of this optimization, though, take also into account the actual results you obtain might differ from the ones you expected.
Anyway, you can change the optimization parameters by setting, under the specific Optimization Parameters node, the following:
| Max. No. of loops |
The maximum number of iterations. Decrease the number to reduce the execution time (but the result will generally be worse) |
| Flexibility |
Increase this number to better optimize the result. |


 Curve
Curve Tension
 )
)
